Archived information
This content is archived because Status of Women Canada no longer exists. Please visit the Women and Gender Equality Canada.
Archived information is provided for reference, research or recordkeeping purposes. It is not subject to the Government of Canada Web Standards and has not been altered or updated since it was archived. Please contact us to request a format other than those available.
Infographic: Women with Disabilities
Infographic: Women with Disabilities
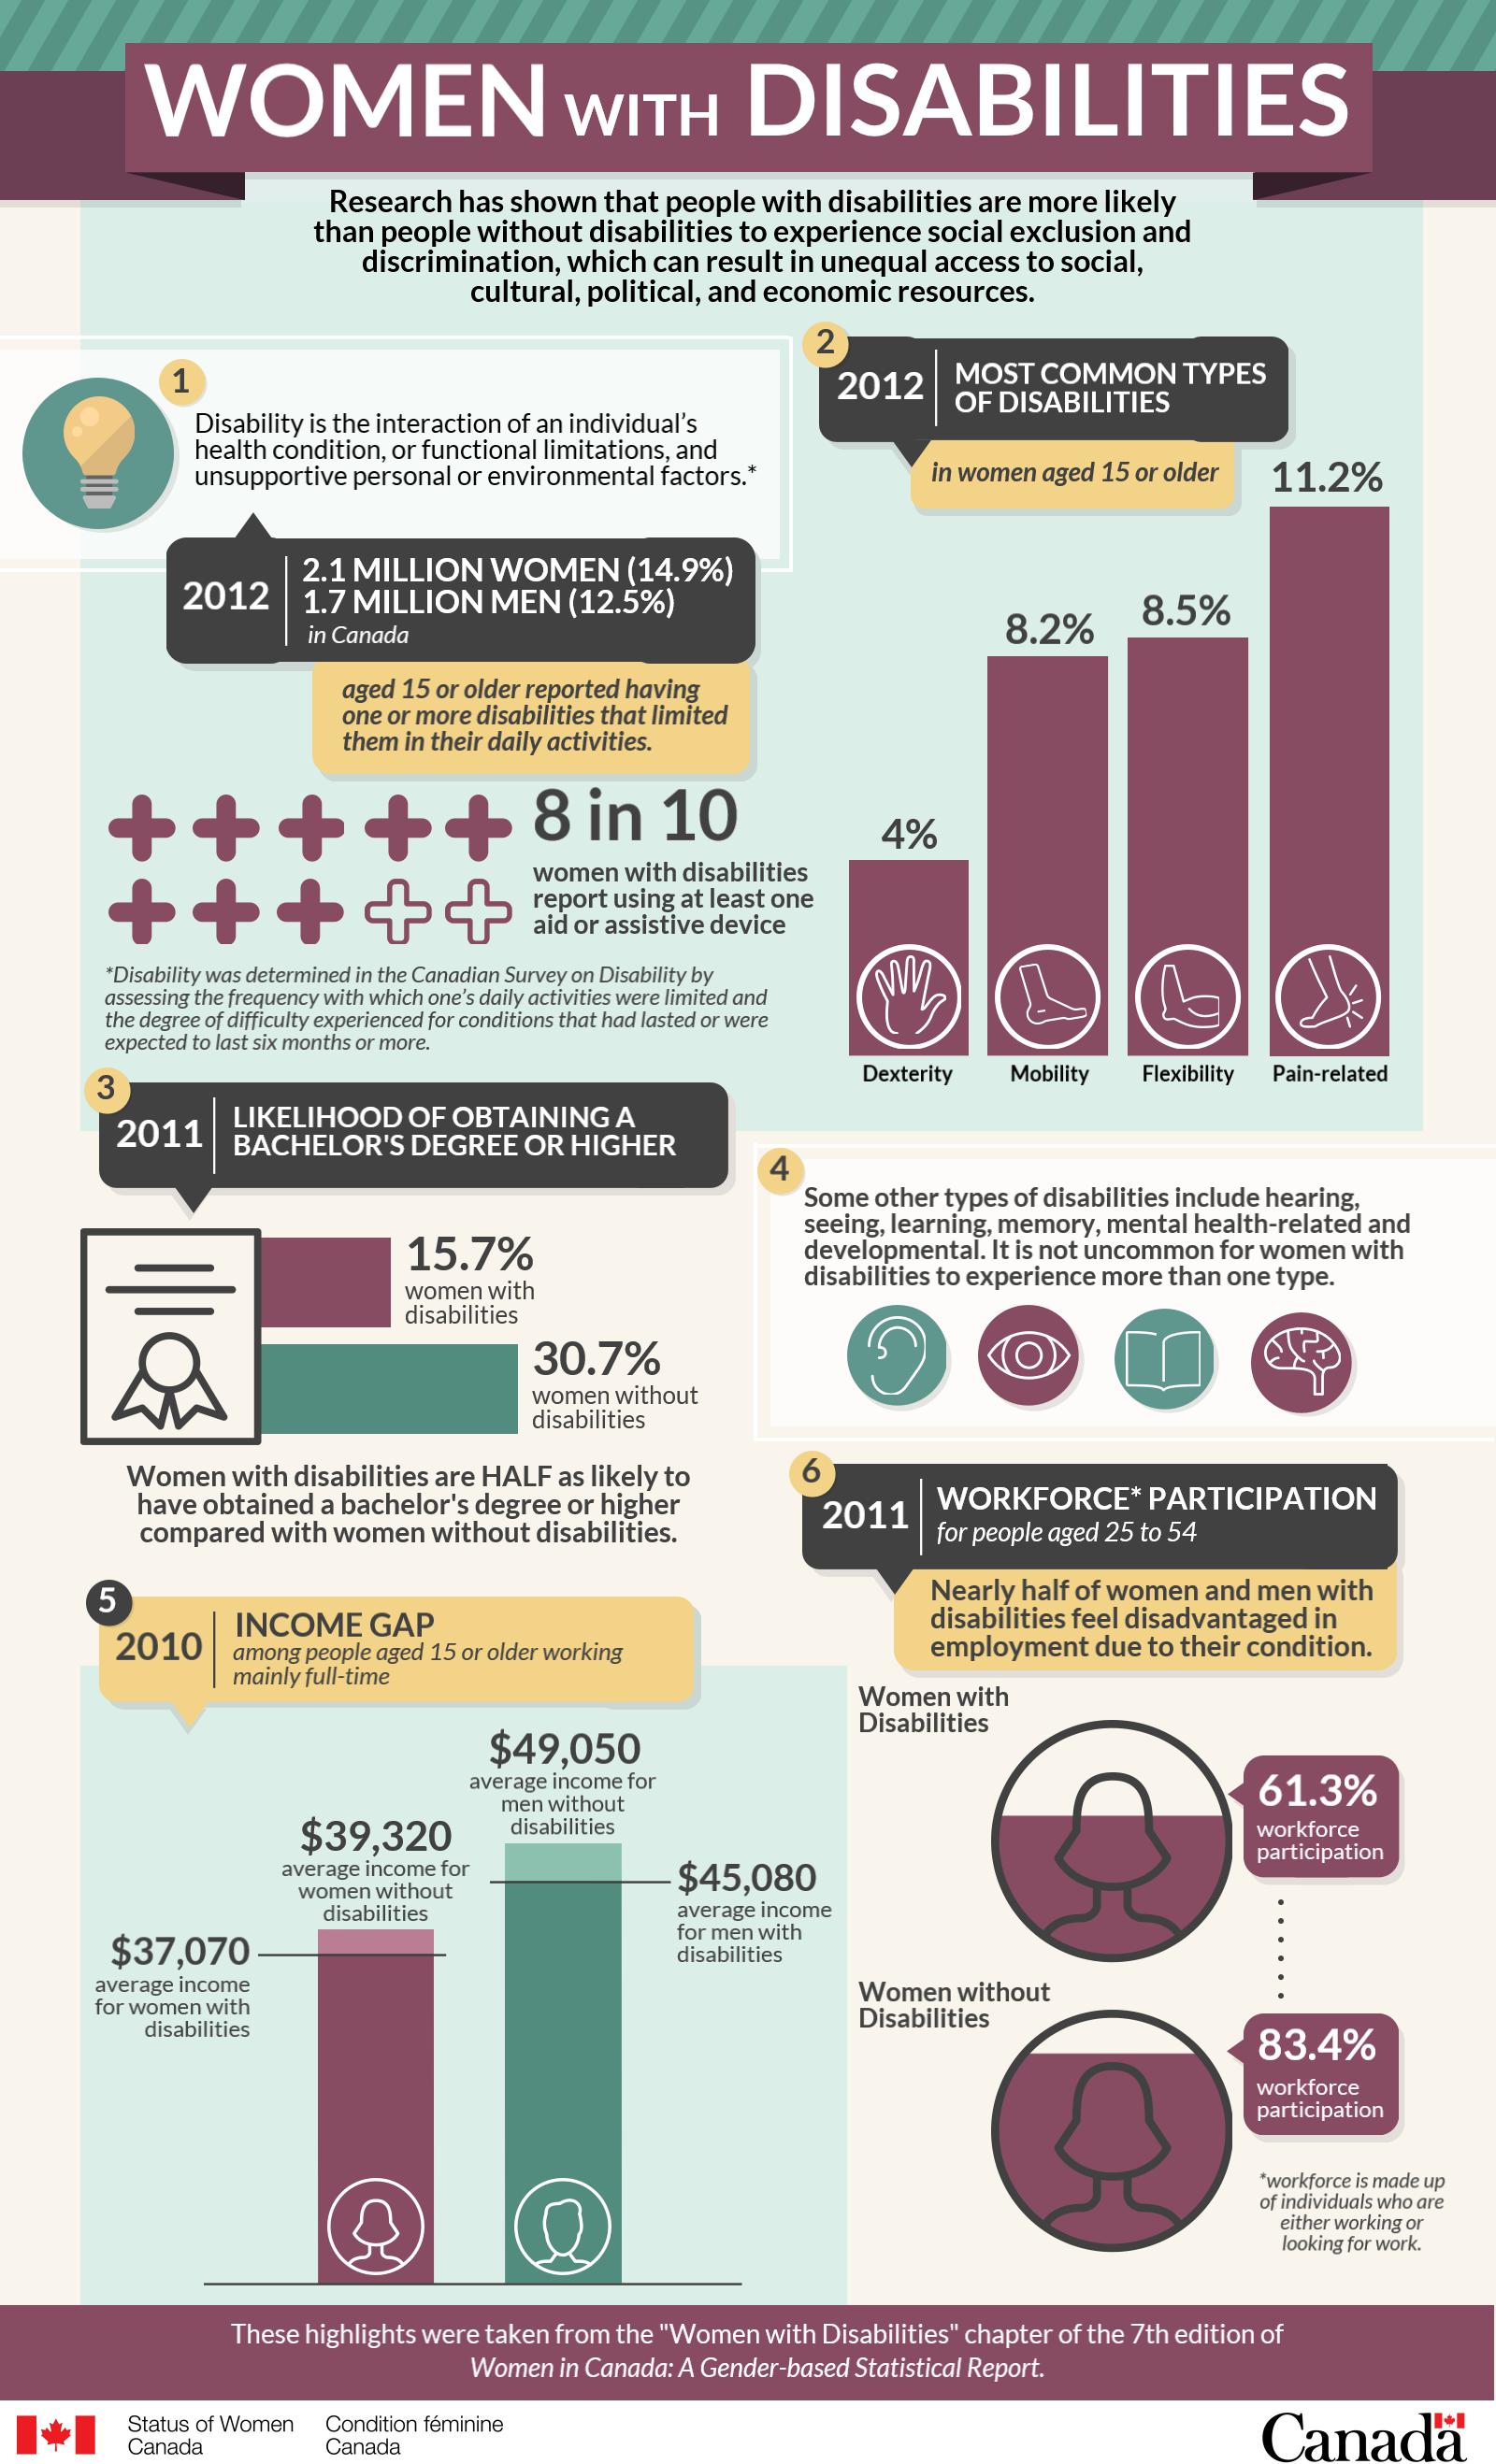
Research has shown that people with disabilities are more likely than people without disabilities to experience social exclusion and discrimination, which can result in unequal access to social, cultural, political, and economic resources.
[in text box]
-
Disability is the interaction of an individual’s health condition, or functional limitations, and unsupportive personal or environmental factors.*
*Disability was determined in the Canadian Survey on Disability by assessing the frequency with which one’s daily activities were limited and the degree of difficulty experienced for conditions that had lasted or were expected to last six months or more.
[below]
2012: 2.1 million women (14.9%)
1.7 million men (12.5%)
In Canada[below]
aged 15 or older reported having one or more disabilities that limited them in their daily activities. -
2012: Most Common Types of Disabilities (in women aged 15 or older)
[bar graph]
Dexterity: 4%
Mobility: 8.2%
Flexibility: 8.5%
Pain-related: 11.2%Some other types of disabilities can include hearing, seeing, learning, memory, mental health-related and developmental. It is not uncommon for women with disabilities to experience more than one type.
[icon graph]
8 in 10 women with disabilities report using at least one aid or assistive device. -
2011: Likelihood of Obtaining a Bachelor’s Degree or Higher
[bar graph]
15.7%
women with disabilities
30.7%
women without disabilitiesWomen with disabilities are half as likely to have obtained a bachelor’s degree or higher compared with women without disabilities.
-
Types of Disability
Seeing, hearing, mobility, flexibility, dexterity, pain, learning, developmental, mental/psychological and memory.
-
2010: Income Gap among people aged 15 or older working mainly full-time
[graph]
$37,070: average income for women with disabilities
$39,320: average income for women without disabilities
$49,050: average income for men without disabilities
$45,080: average income for men with disabilities -
2011: Workforce Participation* for people aged 25 to 54
Nearly half of women and men with disabilities feel disadvantaged in employment due to their condition.
[graph]
Women with Disabilities
61.3 % workforce participation
Women without Disabilities
83.4% workforce participation*workforce is made up of individuals who are either working or looking for work.
[bottom]
These highlights were taken from the “Women with Disabilities” chapter of the 7th edition of Women in Canada: a Gender-based Statistical Report.
- Date modified: