Archived information
This content is archived because Status of Women Canada no longer exists. Please visit the Women and Gender Equality Canada.
Archived information is provided for reference, research or recordkeeping purposes. It is not subject to the Government of Canada Web Standards and has not been altered or updated since it was archived. Please contact us to request a format other than those available.
Analysis of trends in spending and human resources
Actual expenditures
Departmental spending trend graph
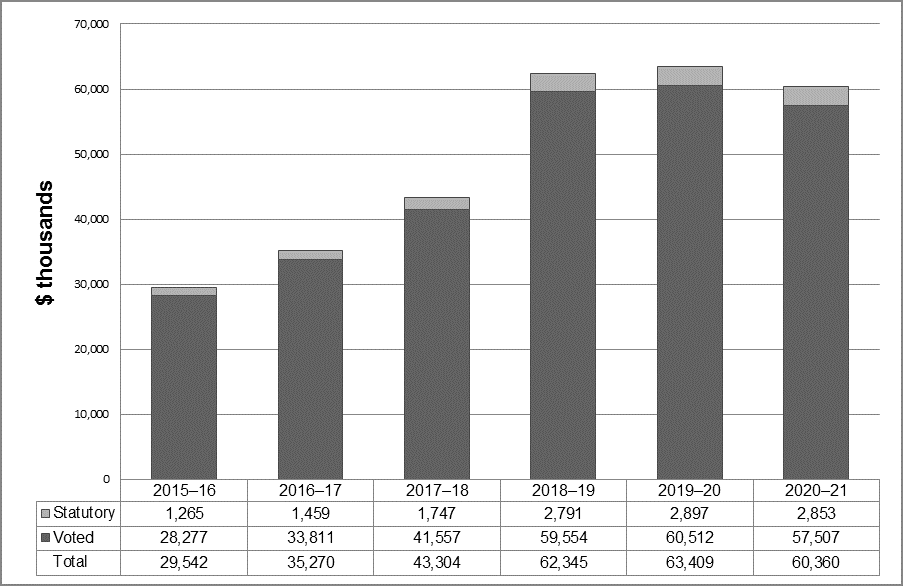
Graph description
| 2015-16 | 2016-17 | 2017-18 | 2018-19 | 2019-20 | 2020-21 | |
|---|---|---|---|---|---|---|
| $ thousands | ||||||
| Statutory | 1,265 | 1,459 | 1,747 | 2,791 | 2,897 | 2,853 |
| Voted | 28,277 | 33,811 | 41,557 | 59,554 | 60,512 | 57,507 |
| Total | 29,542 | 35,270 | 43,304 | 62,345 | 63,409 | 60,360 |
| Programs and Internal Services | 2017–18 Main Estimates |
2017–18 Planned spending |
2018–19 Planned spending |
2019–20 Planned spending |
2017–18 Total authorities available for use | 2017–18 Actual spending (authorities used) |
2016–17 Actual spending (authorities used) | 2015–16 Actual spending (authorities used) |
|---|---|---|---|---|---|---|---|---|
| Strategic Advice, Expertise and Promotion of Gender Equality |
3,153,970 |
3,153,970 |
20,720,236 |
18,546,674 |
5,665,804 |
6,823,305 |
2,890,415 |
1,852,185 |
|
Advancing Equality for Women |
28,798,443 |
28,798,443 |
32,149,150 |
35,339,813 |
29,289,758 |
26,764,597 |
25,199,902 |
22,459,620 |
| Subtotal |
31,952,413 |
31,952,413 |
52,869,386 |
53,886,487 |
34,955,562 |
33,587,902 |
28,090,317 |
24,311,805 |
|
Internal Services |
6,025,008 |
6,025,008 |
9,475,409 |
9,522,874 |
9,707,856 |
9,716,331 |
7,179,299 |
5,230,596 |
| Total |
37,977,421 |
37,977,421 |
62,344,795 |
63,409,361 |
44,663,418 |
43,304,233 |
35,269,616 |
29,542,401 |
Planned spending for 2017–18 of $37,977,421 was based on funding through Main Estimates, plus an estimate of additional funding to be received in-year for the carry-forward of unused funding from the previous year. The $44,663,418 in total authorities available for use in 2017–18 is higher than planned spending because SWC received additional funding during the fiscal year as a result of Budget 2016 and Budget 2017, for an increase in capacity and new initiatives, including Canada’s Strategy to Prevent and Address Gender-Based Violence.
Planned spending for fiscal years 2018–19 and 2019–20 are $62.3 and $63.4 million respectively, which is the anticipated funding to be received through the Main Estimates.
Actual spending in 2017–18 of $43,304,233 is lower than authorities available for use, and resulted in a lapse of $1,359,127 as reported in the Public Accounts of Canada. This lapse is a result of timing issues, where some hiring and activities could not be completed during the fiscal year. Approximately $780,000 of the lapse will be available as an operating carry forward in the next fiscal year.
Actual human resources
| Programs and Internal Services |
2015–16 Actual full-time equivalents |
2016–17 Actual full-time equivalents |
2017–18 Planned full-time equivalents |
2017–18 Actual full-time equivalents |
2018–19 Planned full-time equivalents |
2019–20 Planned full-time equivalents |
|---|---|---|---|---|---|---|
|
Strategic Advice, Expertise and Promotion of Gender Equality |
17 |
19 |
24 |
37 |
67 |
72 |
|
Advancing Equality for Women |
38 |
43 |
55 |
42 |
59 |
59 |
| Subtotal |
55 |
62 |
79 |
79 |
126 |
131 |
|
Internal Services |
44 |
51 |
57 |
65 |
81 |
83 |
| Total |
99 |
113 |
136 |
144 |
207 |
214 |
SWC received additional funding for new hires during the year as a result of Budget 2016 and Budget 2017. Additionally, the staffing process for new hires was not completed during the year. SWC was provided funding for 158 FTEs in 2017–18 and some of this funding was used to hire temporary help services.
Expenditures by vote
For information on Status of Women Canada’s organizational voted and statutory expenditures, consult the Public Accounts of Canada 2017–2018.
Government of Canada spending and activities
Information on the alignment of Status of Women Canada’s spending with the Government of Canada’s spending and activities is available in the GC InfoBase.
Financial statements and financial statements highlights
Financial statements
Status of Women Canada’s financial statements (unaudited) for the year ended March 31, 2018, are available on the departmental website.
Financial statements highlights
|
Financial information |
2017–18 |
2017–18 |
2016–17 |
Difference (2017–18 Actual results minus 2017–18 Planned results) |
Difference (2017–18 Actual results minus 2016–17 Actual results) |
|---|---|---|---|---|---|
|
Total expenses |
39,986,000 |
46,932,252 |
36,301,531 |
6,946,252 |
10,630,721 |
|
Total revenues |
0 |
252 |
0 |
252 |
252 |
|
Net cost of operations before government funding and transfers |
39,986,000 |
46,932,000 |
36,301,531 |
6,946,000 |
10,630,469 |
The 2017–18 planned results are based on estimates known at the time of the Departmental Plan. The difference between total expenses for 2017–18 planned results and 2017–18 actuals is mainly due to events not known during the planning phase. Planned expenses for 2017–18 were estimated at $40 million while actual expenses are higher at $47 million. This is due to additional funding having been received during the year after the 2017–18 planning phase.
On an accrual accounting basis, SWC total operating expenses for 2017–18 are $46.9 million, an increase of $10.6 million (29%) when compared to the previous fiscal year. Transfer payments ($20.8 million) accounted for 44% of total expenses with only a slight increase of 2% from the previous year. However the main increase can be attributed to the following expenses which account for 50% of total expenses: salaries ($16.5 million), professional services ($4.9 million), and accommodation ($2.1 million).
SWC’s revenues are incidental and result from proceeds from the disposal of assets that are no longer being used, and fees generated by requests under the Access to Information Act.
|
Financial information |
2017–18 |
2016–17 |
Difference |
|---|---|---|---|
|
Total net liabilities |
4,710,758 |
2,246,896 |
2,463,862 |
|
Total net financial assets |
3,619,496 |
1,333,183 |
2,286,313 |
|
Departmental net debt |
1,091,262 |
913,713 |
177,549 |
|
Total non-financial assets |
1,364,799 |
1,427,374 |
(62,575) |
|
Departmental net financial position |
273,537 |
513,661 |
(240,124) |
SWC’s total net liabilities are composed of accounts payable and accrued liabilities (72%), employee future benefits (13%), and employee vacation pay and compensatory leave (15%). Increases in total net liabilities are due to the growth in operations experienced by SWC in fiscal year 2017–18 from the previous year.
Total net financial assets consist of accounts receivable, advances, and amounts due from the Consolidated Revenue Fund (CRF) of the Government of Canada. The amount due from the CRF represents 85% or $3 million of the total net financial assets and the remaining 15% is comprised of accounts receivable and advances. The amount due from the CRF represents the amount of net cash that SWC is entitled to draw from the CRF in the future to discharge its current liabilities, without further appropriations. On a gross basis, the amount of accounts receivable and advances outstanding at year-end more than doubled between years, and is attributed in part to the transition to the new Phoenix pay system.
Total non-financial assets consist of tangible capital assets, which make up 100% of the balance. The amount and composition of SWC’s non-financial assets have remained consistent between the two fiscal years. The slight decrease in 2017–18 is attributed to acquisitions of $0.2 million which was offset by $0.3 million in amortization.
- Date modified: